
TravelTime API · Accuracy benchmarks
Compare TravelTime accuracy vs leading alternatives
How accurate is TravelTime, really?
We ran thousands of driving routes across the globe through TravelTime, TomTom, HERE, Mapbox, Valhalla and OSRM — scoring each against Google’s predicted travel time. Every result, every cut of the data, on one page.
TravelTime is available globally. Get started with a free API key to do an accuracy comparison in your region.
How accurate is TravelTime in the US?
We ran over 100,000 driving routes in the US through TravelTime, TomTom, HERE, Mapbox, Valhalla and OSRM, scored each against Google’s predicted travel time, and put every cut of the data on this page.
The bottom line? TravelTime is in the top tier on every cut of the data.
No matter the time of day or location, TravelTime reliably ranks among the most accurate API providers. Dive into the full comparison below.
Absolute time error
TravelTime has the lowest error of any provider
RMSE (root-mean-square error) is the typical difference in seconds between a provider’s predicted travel time and Google’s. The lower the number, the closer it is to the Google benchmark.
The average trip in this dataset is 46 minutes.
| Rank | Provider | RMSE (seconds) | % higher than best |
|---|---|---|---|
| 1 | TravelTime | 498 | n/a |
| 2 | TomTom | 592 | +19% |
| 3 | HERE | 633 | +27% |
| 4 | Mapbox | 972 | +95% |
| 5 | Valhalla | 1190 | +139% |
| 6 | OSRM | 1452 | +192% |
Time of day
How does accuracy change throughout the day?
With Google as our benchmark, this graph shows how each drive-time provider compares across different times of day. This is where traffic and peak time modelling matters.
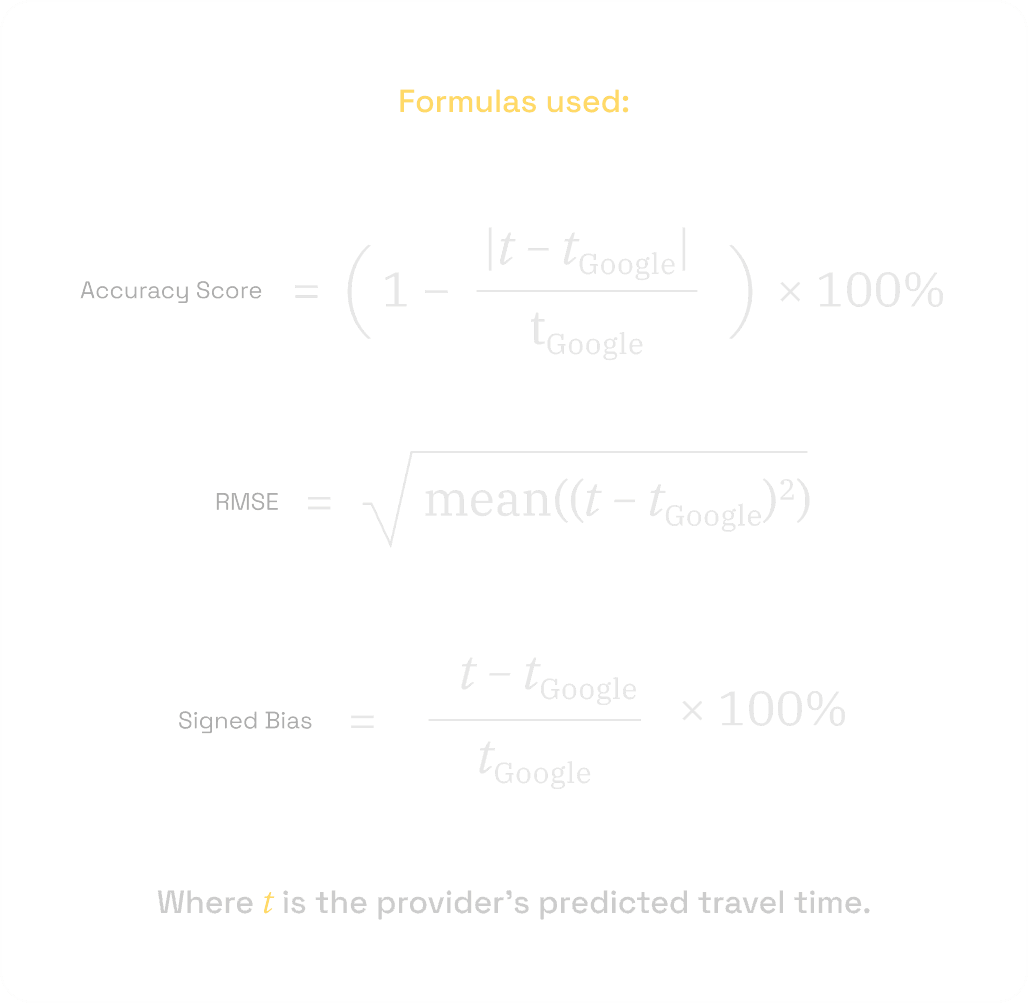
See how Accuracy score is calculated.
| Provider | 05:00 | 13:00 | 17:00 |
|---|---|---|---|
| TomTom | 90.58% | 90.90% | 90.25% |
| TravelTime | 88.85% | 87.24% | 85.44% |
| HERE | 87.10% | 84.89% | 84.08% |
| Mapbox | 65.50% | 80.30% | 79.00% |
| Valhalla | 72.15% | 72.08% | 70.19% |
| OSRM | 54.49% | 57.01% | 55.53% |
By state
State-by-state accuracy breakdown
Every provider’s accuracy varies by state. A strong national average can hide weak spots.
This map shows how each provider holds up state by state. Pick a provider to see its national coverage, or hover any state to compare all six.
Accuracy Score (relative to Google)
| State | TravelTime | Mapbox | HERE | TomTom | Valhalla | OSRM |
|---|---|---|---|---|---|---|
| Alabama | 89.09% | 82.59% | 84.70% | 95.04% | 72.02% | 46.41% |
| Alaska | 82.91% | 58.61% | 65.92% | 91.71% | 76.92% | 48.01% |
| Arizona | 82.83% | 62.62% | 74.22% | 67.58% | 60.08% | 49.04% |
| Arkansas | 86.94% | 75.40% | 83.35% | 93.30% | 67.95% | 53.24% |
| California | 81.26% | 75.84% | 85.94% | 77.17% | 79.48% | 66.77% |
| Colorado | 85.96% | 43.32% | 70.94% | 79.64% | 20.42% | 6.60% |
| Connecticut | 92.77% | 80.54% | 90.32% | 95.90% | 89.83% | 71.98% |
| Delaware | 82.15% | 84.23% | 88.74% | 94.81% | 79.51% | 74.51% |
| Florida | 85.73% | 85.65% | 92.15% | 94.68% | 86.81% | 74.55% |
| Georgia | 85.74% | 85.83% | 88.66% | 95.18% | 81.66% | 72.77% |
| Hawaii | 86.85% | 78.77% | 77.47% | 85.45% | 87.38% | 73.22% |
| Idaho | 84.01% | 69.36% | 68.46% | 86.39% | 71.93% | 48.10% |
| Illinois | 83.37% | 76.86% | 92.39% | 96.81% | 75.32% | 49.18% |
| Indiana | 78.94% | 80.58% | 76.70% | 95.15% | 68.98% | 47.12% |
| Iowa | 83.22% | 72.48% | 93.76% | 92.55% | 70.25% | 52.30% |
| Kansas | 85.38% | 65.73% | 86.01% | 87.21% | 44.44% | 21.71% |
| Kentucky | 86.58% | 78.09% | 92.55% | 95.00% | 82.04% | 61.48% |
| Louisiana | 92.07% | 76.47% | 89.00% | 94.89% | 76.32% | 55.92% |
| Maine | 88.32% | 76.12% | 84.58% | 91.25% | 71.85% | 52.73% |
| Maryland | 90.74% | 80.64% | 90.39% | 96.04% | 84.52% | 64.03% |
| Massachusetts | 90.88% | 81.05% | 88.45% | 95.45% | 85.64% | 70.59% |
| Michigan | 87.40% | 79.85% | 91.54% | 95.24% | 76.06% | 59.67% |
| Minnesota | 86.85% | 68.38% | 85.26% | 92.21% | 52.68% | 42.08% |
| Mississippi | 93.14% | 76.69% | 85.99% | 96.40% | 65.43% | 40.26% |
| Missouri | 86.36% | 74.60% | 79.34% | 92.14% | 64.01% | 45.77% |
| Montana | 83.16% | 36.12% | 52.14% | 74.58% | 28.61% | 10.58% |
| Nebraska | 91.13% | 81.75% | 92.88% | 87.08% | 85.05% | 84.64% |
| Nevada | 84.18% | 59.06% | 76.89% | 79.80% | 61.60% | 59.65% |
| New Hampshire | 93.58% | 78.59% | 91.52% | 84.66% | 78.44% | 63.20% |
| New Jersey | 79.52% | 85.35% | 93.93% | 93.16% | 89.60% | 82.37% |
| New Mexico | 83.64% | 63.99% | 85.43% | 79.74% | 67.95% | 49.03% |
| New York | 87.83% | 77.82% | 89.59% | 95.56% | 80.33% | 59.83% |
| North Carolina | 82.99% | 84.57% | 84.70% | 96.00% | 85.15% | 65.24% |
| North Dakota | 85.65% | 69.32% | 89.67% | 91.09% | 31.84% | 37.13% |
| Ohio | 89.61% | 81.40% | 94.44% | 97.14% | 84.08% | 63.90% |
| Oklahoma | 88.38% | 72.04% | 81.34% | 89.57% | 69.07% | 47.24% |
| Oregon | 80.22% | 53.96% | 78.13% | 74.24% | 54.22% | 55.84% |
| Pennsylvania | 90.82% | 77.00% | 91.40% | 95.94% | 82.37% | 63.54% |
| Rhode Island | 93.00% | 86.85% | 95.60% | 95.83% | 88.64% | 86.97% |
| South Carolina | 88.99% | 83.69% | 88.12% | 95.23% | 77.85% | 57.29% |
| South Dakota | 88.35% | 66.48% | 81.96% | 83.37% | 40.45% | 30.86% |
| Tennessee | 92.49% | 82.91% | 89.28% | 95.75% | 81.07% | 59.84% |
| Texas | 87.27% | 85.24% | 87.29% | 86.79% | 77.36% | 65.17% |
| Utah | 83.12% | 68.28% | 68.50% | 74.10% | 60.77% | 60.22% |
| Vermont | 90.81% | 72.24% | 84.68% | 94.01% | 72.72% | 64.73% |
| Virginia | 88.87% | 82.97% | 84.61% | 94.49% | 85.76% | 67.42% |
| Washington | 86.41% | 68.25% | 73.06% | 88.44% | 74.87% | 56.25% |
| West Virginia | 90.88% | 75.09% | 83.73% | 90.98% | 87.81% | 72.90% |
| Wisconsin | 91.55% | 80.22% | 93.80% | 96.73% | 84.88% | 61.69% |
| Wyoming | 82.87% | 66.48% | 79.08% | 85.89% | 41.80% | 35.91% |
By accuracy band
How is accuracy distributed?
Averages smooth over the spread. This breaks down what share of each provider’s routes landed in each accuracy band.
Hover a band — in the legend or the chart — to highlight it across providers.
| Provider | ≥95% | 90–95% | 85–90% | 80–85% | 75–80% | <75% | No result |
|---|---|---|---|---|---|---|---|
| TomTom | 57.9% | 20.5% | 7.6% | 3.7% | 2.3% | 8.0% | 0.0% |
| TravelTime | 28.2% | 23.1% | 16.7% | 11.8% | 7.5% | 12.3% | 0.3% |
| HERE | 33.9% | 21.3% | 13.5% | 8.7% | 5.8% | 16.9% | 0.0% |
| Mapbox | 9.2% | 14.1% | 17.4% | 14.7% | 11.0% | 33.6% | 0.0% |
| Valhalla | 14.6% | 13.3% | 11.4% | 9.4% | 8.0% | 37.8% | 5.6% |
| OSRM | 3.4% | 4.0% | 4.9% | 5.8% | 7.0% | 73.0% | 1.8% |
Direction and magnitude
Over-predicting or under-predicting?
Neither Accuracy Score nor RMSE shows which way each provider’s error leans.
Over-predicting means quoting users a longer trip than Google does. Under-predicting means it is a shorter trip.
| Provider | p5 | p25 | Median | p75 | p95 | Over-predicts |
|---|---|---|---|---|---|---|
| TomTom | -8.15% | -1.81% | 1.61% | 6.82% | 35.54% | 62% |
| TravelTime | -22.21% | -6.00% | 3.09% | 12.89% | 30.99% | 59% |
| HERE | -8.36% | 0.33% | 6.98% | 17.67% | 48.51% | 76% |
| Valhalla | -15.96% | 3.14% | 16.82% | 36.21% | 86.92% | 80% |
| Mapbox | -3.87% | 9.61% | 17.45% | 30.29% | 71.66% | 92% |
| OSRM | 0.06% | 24.17% | 38.91% | 57.81% | 99.69% | 95% |
Methodology
How this accuracy comparison was produced
Every number on this page comes from the same dataset and formulas.
The dataset contains 47,000 randomised origin–destination pairs sampled from each of the 50 states in the US, queried at three departure times (05:00, 13:00, 17:00) against six APIs and Google.
The data samples a representative mix of rural and urban routes ranging from 10 minutes to 3 hours.
After filtering routes flagged as bad map-snaps, restricted-road artefacts, or unreachable for any provider (Google included), 100,531 “clean” routes remain.
Google’s predicted travel time is our comparison reference.
Test the accuracy for yourself with a free TravelTime API key.
100,531 clean routes scored across 50 states in the US · benchmarked against Google as ground truth
Dataset — collected 21 June 2026